syncport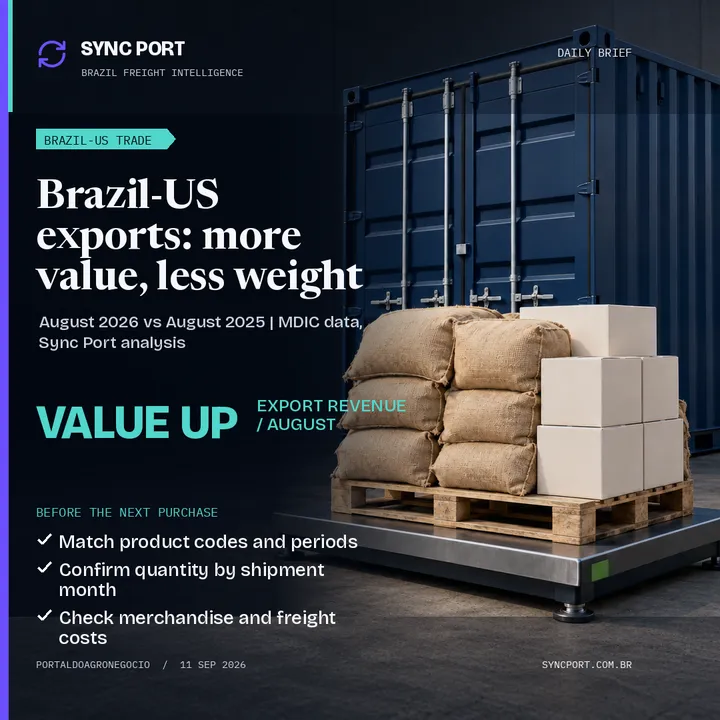
Operational readout
More export revenue, less physical weight
Brazil's goods exports to the United States rose in dollar value in August 2026 even as the weight shipped declined. Sync Port's calculation from the original MDIC Comex Stat files puts exports at US$3.19 billion, up 12.1% from August 2025. Net weight fell 17.3%, to approximately 2.78 million tonnes. The two measures tell different parts of the same trade story: Brazil earned more export revenue from a lighter mix of goods. 2026 official export data, 2025 comparison data
The monthly rebound also sits within a weaker cumulative result. From January through August, goods exports to the US totaled US$24.10 billion, compared with US$26.70 billion in the same period of 2025, a 9.7% decline. Net weight over those eight months fell 19.3%. August's positive revenue comparison therefore did not erase the shortfall accumulated earlier in the year. 2026 data, 2025 data
For international buyers, this is a reason to look beyond the revenue headline. An increase in the value of trade does not automatically mean a larger physical supply, more vessel departures or greater availability from a particular supplier. Purchasing decisions still need the product, quantity and delivery window behind an offer.
The figures were checked against the official files
The story follows September 10 coverage of Amcham Brazil's trade-monitor results. Amcham is the American Chamber of Commerce for Brazil, a business membership organization. Its reported aggregate figures led this edition's research; Sync Port then reproduced the value and weight comparisons directly from the government's export files. September 10 trade coverage
MDIC is Brazil's Ministry of Development, Industry, Trade and Services. Its Secretariat of Foreign Trade, Secex, produces the goods-trade statistics made available through Comex Stat. The open files separate the year, month, destination, product classification, net weight and declared export value. This lets a reader compare the same destination and period without treating different statistical measures as interchangeable. MDIC open-data documentation
Key facts
Value, weight and unit value answer different questions
Confirmed fact: the August comparison is US$3,190,410,423 against US$2,845,136,877 in export value. Net weight is 2,775,742,197 kilograms against 3,358,099,348 kilograms. The percentage changes in this report are calculated from those unrounded totals; displayed billions and tonnes are rounded for readability. 2026 source file, 2025 source file
The value measure is nominal FOB US dollars. FOB means Free on Board; the statistical value is not the buyer's complete delivered cost. International freight, insurance and other destination-side costs need their own assessment. MDIC also distinguishes net kilograms from product-specific statistical quantities, whose units can vary between products. Adding unlike statistical units would not give a meaningful physical total. MDIC definitions
Dividing total export dollars by total net kilograms produces an aggregate unit value. That ratio increased 35.7% in August compared with a year earlier. It helps reconcile rising revenue with falling weight, but it is not a price increase that applies to every Brazilian product. A change in the mix of heavy, lower-value goods and lighter, higher-value goods can move the ratio even when individual product prices behave differently. This calculation does not separate the contribution of prices from the contribution of the product mix. Calculation inputs for 2026, comparison inputs for 2025
A monthly rebound and an eight-month decline can coexist
August is one month, while January-August includes seven earlier months. Both comparisons use the equivalent period of 2025. Neither is a full-year forecast. Likewise, these totals cover merchandise exports destined for the United States; they do not describe services, every Brazilian export market or the performance of every product within the US trade flow. Official data and coverage
The data establish what was recorded in trade value and mass. They do not, by themselves, isolate the causes of the change. Tariffs, contract timing, demand and product composition require separate evidence before they can be assigned a share of the result. The same distinction applies operationally: kilograms cannot be converted directly into container counts, terminal throughput or vessel utilization.
Operational table
| Measure and comparison | Result and interpretation |
|---|---|
| August export value, 2026 versus 2025 | US$3.19bn versus US$2.85bn: +12.1% in nominal FOB dollars. |
| August net weight, 2026 versus 2025 | 2.78m versus 3.36m tonnes: -17.3% in recorded physical mass. |
| January-August export value | US$24.10bn versus US$26.70bn: -9.7% over the equivalent eight months. |
| January-August net weight | 22.68m versus 28.10m tonnes: -19.3%; a different measure from export revenue. |
| August FOB dollars per net kilogram | +35.7% in aggregate unit value; this does not establish a like-for-like price increase. |
Table: Sync Port calculations using the 2026 MDIC export file and 2025 comparison file, retrieved September 11, 2026. One tonne equals 1,000 kilograms.
What to check now
- Compare the same product code, destination and period before applying the bilateral trend to a purchase plan.
- Ask the supplier for available quantity by specification and shipment month, with the unit stated explicitly.
- Separate changes in the merchandise quotation from freight, insurance and other landed-cost assumptions.
- Confirm the shipment window and allocation with the supplier and logistics provider before increasing an order on the strength of the revenue headline.
Recommended operational decision
Operational inference: the divergence between value and weight makes product-level evidence more useful than a single aggregate trade headline for procurement. Recommended action: keep price, available quantity and shipping arrangements as separate decisions. Update each when comparable product data or an actual supplier offer supports the change. The national statistics provide market context; the commercial commitment needs evidence for the order itself.
From market analysis to your next shipment
Before committing to a purchase, compare product and transport terms separately. See how our freight forwarding service works. To evaluate transport for the order, request a quotation with the origin, destination and cargo description.
Frequently asked questions
Does lower net weight mean fewer containers or sailings?
No direct conclusion follows. Products differ in density, packaging and transport mode. The files report net mass and export value; this calculation does not measure TEU, vessel calls or terminal utilization. Buyers should use the relevant carrier and terminal information for those operational questions. Measures in the official files
Should the 35.7% unit-value increase be used to adjust a supplier's quotation?
It should not be used as an automatic escalator. It is a ratio across a changing basket of goods, not the price of a fixed specification. Compare the supplier's actual product, commercial terms and shipment period. Freight and insurance should also be checked separately from the nominal FOB merchandise value. Statistical valuation and units
Terms and signals to monitor
Track nominal FOB value, net weight and product mix together, keeping monthly and year-to-date comparisons separate. For product-level work, NCM is the Mercosur product nomenclature used in the detailed data; comparable codes and consistent units matter more than a broad sector label. MDIC data structure
MDIC revises current-year statistics as declarations are corrected and reprocessed. Retain the extraction date when comparing releases. This edition uses the original files retrieved on September 11 and two calculation methods that produced identical totals and record counts. The check reproduces the arithmetic from the same official data; it does not create an independent statistical survey. MDIC revision policy